India's Crime Trend Dashboard
Python : Pandas : Plotly : Streamlit : Live
Understanding the alarming trends of crime in India, particularly rape
and suicide, is crucial. Rape is the fourth most common crime against
women in India. According to the
National Crime Records Bureau (NCRB),
one rape was reported every 16 minutes in 2019, and every 15 minutes
in 2018.
The
interactive dashboard,
powered by Streamlit, offers a comprehensive analysis and visual
representation of crime data from 2001 to 2012. This blog post
explores the key features and benefits of using this dashboard,
focusing on rape and suicide statistics across various states and
years.
I made some suggestions how these interactions could be like and
illustrated them in short interaction videos.
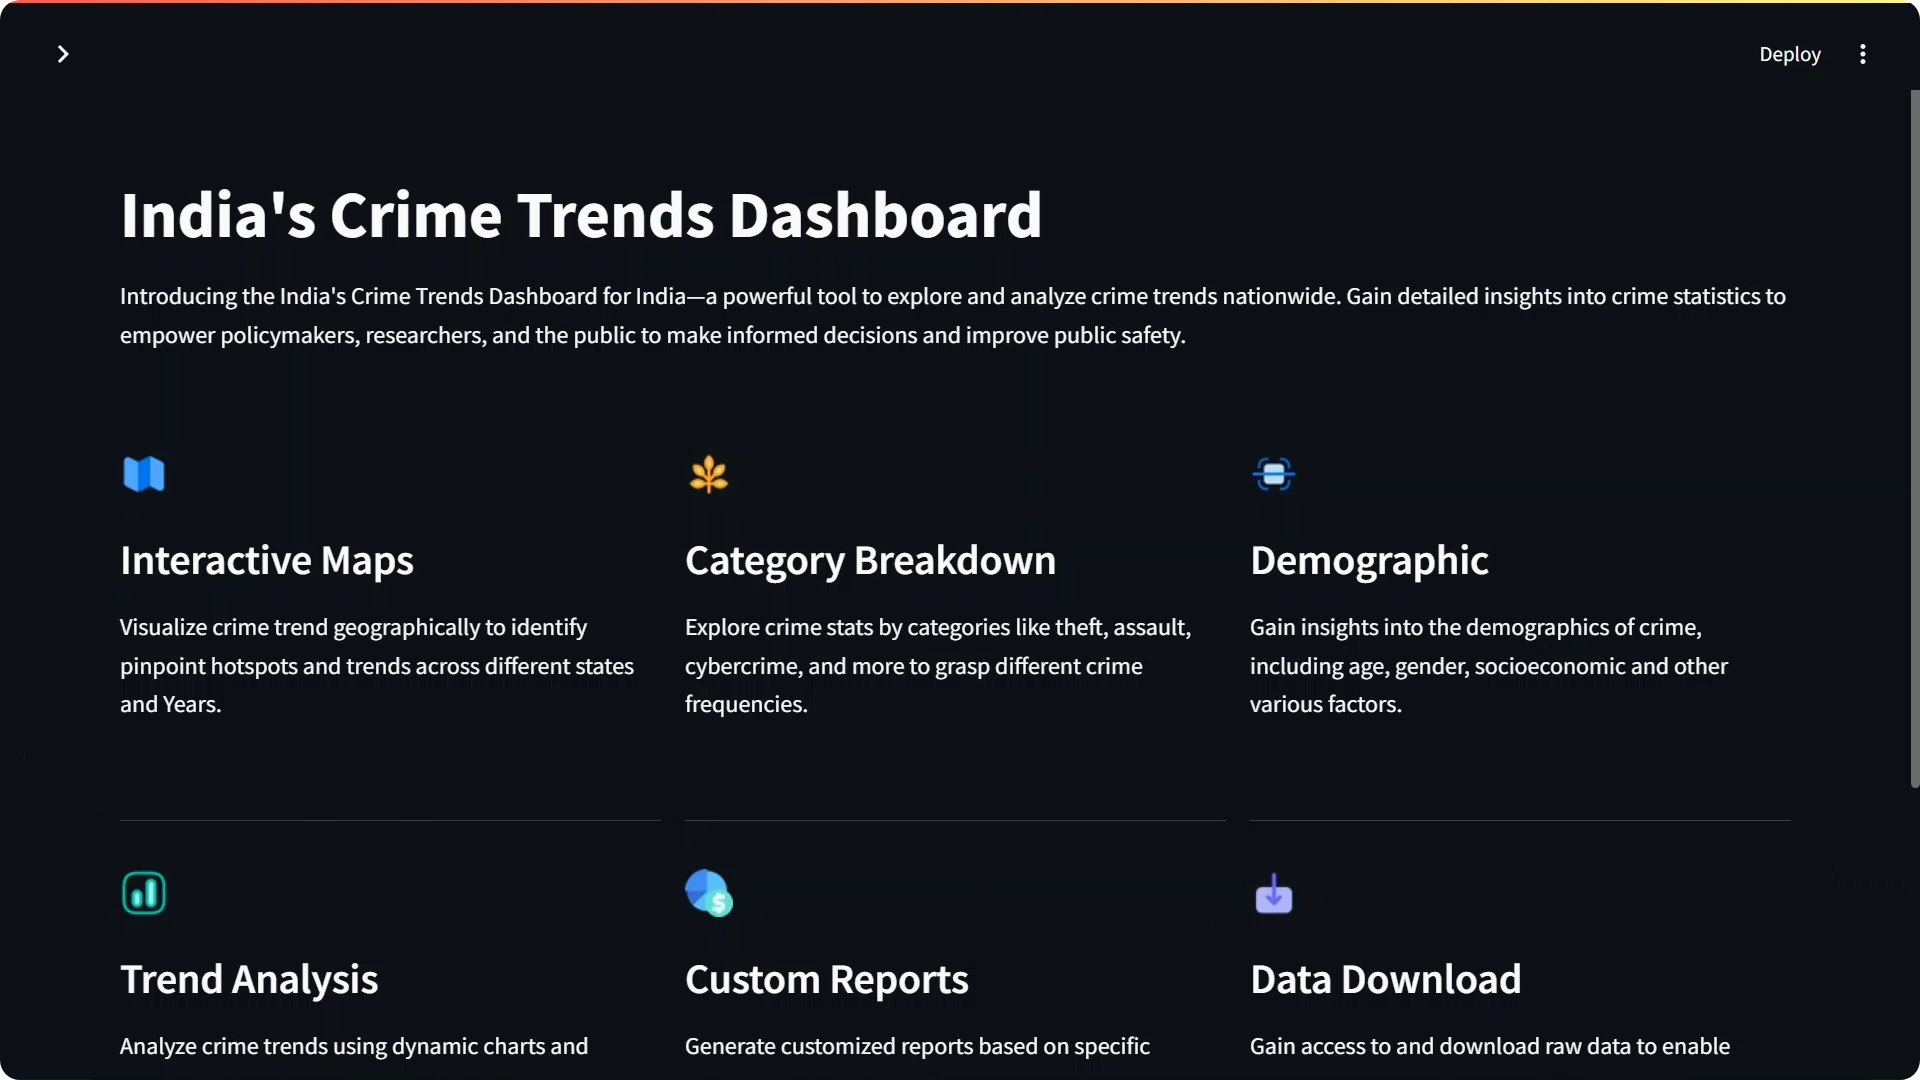
What is the India's Crime Trend Dashboard?
The India's Crime Trend Dashboard is a user-friendly platform that provides an in-depth analysis of rape and suicide victim data. It utilizes Python libraries such as Pandas and Plotly Express to offer visualizations and statistics across different states and years.
With this dashboard, you can:- Explore Crime Categories: Select various crime categories for analysis.
- Analyze Rape Victims: Investigate trends in reported rape cases across different states and years.
- Analyze Suicide Cases: Examine trends in reported suicide cases across different states and years.
Key Features of the India's Crime Trend Dashboard
Let's take a closer look at some of the key features offered by the dashboard:
- User-Friendly Interface: Navigate through different sections with ease. Select areas of interest such as rape victims, suicide victims, and more from the sidebar
- Detailed Insights: Get comprehensive insights into each area. Choose specific states or view nationwide data and explore trends over selected years.
- Visualizations and Metrics: Utilize Plotly Express to create interactive visualizations like bar charts, line graphs, and scatter plots. Customize charts by selecting different types and metrics, and view state-wise data on an Indian map.
- Data Filtering: Filter data by state, year, or specific metrics to gain targeted insights.
- Comprehensive State Comparisons: Compare reported victim cases across all states using an interactive Indian map.
How to Use the India's Crime Trend Dashboard
- Navigate to the Dashboard: Access the dashboard by running the provided code in a Streamlit environment.
- Choose an Area of Interest: Select sections like Home, Reports, or Dataset from the sidebar.
-
Explore Reports:
- Select Crime Category: Choose the crime category you want to analyze.
- Select State: Pick a specific state or view nationwide data.
- Select Year: Filter by year or select all years to view trends over time.
- Explore Insights: Browse visualizations and statistics for your selected area, and customize charts as needed.
- Discover Trends: Analyze data for different states and years to gain a deeper understanding of crime trends in India.
- Access the Dataset: Download the dataset for further analysis from the Dataset section.
Future Scope of the India's Crime Trend Dashboard
The India's Crime Trend Dashboard has the potential for further enhancements and features. Some future scope areas include:
- Additional Crime Categories: Include more crime categories for analysis, such as kidnapping, dowry death, cruelty by husband and relatives, theft, assault, and more.
- Extend Data Range: Extend the dataset to include more recent years and updated crime statistics. This could provide a more current and accurate analysis of crime trends in India.
- Integrate Custom Visualizations: Allow users to select parameters like x-axis, y-axis, color, and size for more interactive charts.
- Machine Learning Models: Incorporate machine learning models for predictive analysis and trend forecasting. This could help in identifying high-risk areas and taking preventive measures.
Short conclusion - India's Crime Trend Dashboard
The India's Crime Trend Dashboard is a valuable resource for analyzing
and understanding crime trends in India. By providing detailed
insights and visualizations, this dashboard can help policymakers,
researchers, and concerned citizens make informed decisions to address
critical issues.
With its user-friendly interface and comprehensive data analysis, the
dashboard is a powerful tool for exploring crime data and identifying
patterns over time. Leveraging the latest technologies and data
visualization techniques, this dashboard aims to raise awareness and
drive positive societal change.
Source Code:
GitHub (Private)